New ice core time scale results published
The Copenhagen Dating Initative and the GICC05 time scale
During 2002-2006, the Carlsberg Foundation funded the Copenhagen Dating Initiative with the purpose of obtaining the optimal ice core chronology for the Greenland ice cores. The resulting time scale is called the Greenland Ice Core Chronology (GICC05). The time scale uses data from different ice cores to allow the best possibilities for annual layer counting in all time intervals, and is based on data from the NGRIP ice core only in the glacial.
A common time scale
Researchers at the Centre for Ice and Climate have matched the NGRIP ice core to the two other Central Greenland ice cores, GRIP and GISP2, using reference horizons of mainly volcanic origin. Using these time-marker horizons, the GICC05 time scale has been transferred to the GRIP and GISP2 ice cores, thereby making it possible to study the records of past climate change from all three ice cores on the same time scale.
When studied on a common time scale, differences between the records can be identified and interpreted in much improved detail, thereby disclosing new information about past climate change.

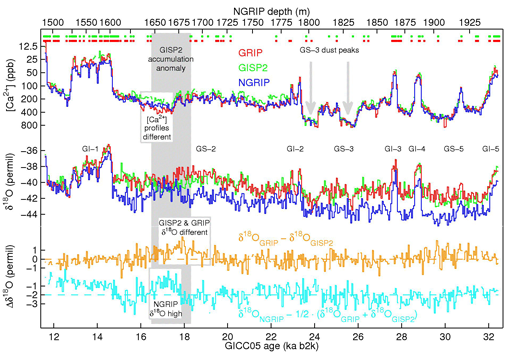
The figure shows 50-year average values of δ18O and [Ca2+] on the GICC05 time scale (GRIP (red), GISP2 (green), NGRIP (blue)). The dots in the top show the position of the match points used to synchronize the NGRIP ice core with the GRIP (red dots) and GISP2 (green dots) cores.
Differences in the glacial climate records
In the bottom of the plot, the differences between the isotope curves are illustrated: the orange curve shows the difference between the δ18O values in GRIP and GISP2, while the cyan curve shows the δ18O offset between the NGRIP profile and the mean of the GRIP and GISP2 profiles. The matching also reveals a period where the annual layers are unusually thick in the GISP2 ice core, which is interpreted as a period of increased snow accumulation 16.5 - 18.3 thousand years before present. The period is marked as the grey shaded interval, while the three boxes indicate the position of intervals of anomalous δ18O values and [Ca2+] values. These differences are discussed in detail in the paper "Synchronization of the NGRIP, GRIP, and GISP2 ice cores across MIS 2 and palaeoclimatic implications" which was published in January 2008.
Read more
S. O. Rasmussen, I. K. Seierstad, K. K. Andersen, M. Bigler, D. Dahl-Jensen and S. J. Johnsen
Synchronization of the NGRIP, GRIP, and GISP2 ice cores across MIS 2 and palaeoclimatic implications
Quaternary Science Reviews 27 (2008), p. 18-28
